Evaluatation
This page features functions for computing metrics to evaluate portfolio performance and printing the evaluation report.
Calculate Evaluation Metrics
update-eval-report
This function updates the evaluation metrics in the record. (see print-eval-report for the list of evaluation metrics computed)
| No Argument |
|---|
Return
nil
Example
=> (update-eval-report)
;; update the evaluation metrics today
Inspection of Evaluation Report
print-eval-report
This function prints the evaluation report that includes all summary statiscs in a table format.
Parameters:
n- no. of rows to print, if n <= 0, print entire record
Ouput explanation:
| Column | Format | Meaning |
|---|---|---|
date | YYYY-MM-DD | Date of record |
tot-val | int, % | Total value of the portfolio, including cash and all purchased stocks |
vol | float, % | Volatility of the portfolio caculated with an expanding window |
r-vol | float, % | Volatility of the portfolio caculated with a rolling window |
sharpe | float, % | Sharpe ratio of the portfolio caculated with an expanding window |
r-sharpe | float, % | Sharpe ratio of the portfolio caculated with a rolling window |
pnl-pt | float, $ | Profit and loss per trade |
max-drawdown | float, $ | Maximum drawdown of the portfolio |
Example:
(eval-report -1)

;; output:

|      :date | :tot-value |    :vol |  :r-vol |  :sharpe | :r-sharpe | :pnl-pt | :max-drawdown |
|------------+------------+---------+---------+----------+-----------+---------+---------------|
| 1980-12-15 |     $10000 | 0.0000% | 0.0000% |  0.0000% |   0.0000% |      $0 |        0.0000 |
| 1980-12-16 |     $10000 | 0.0000% | 0.0000% |  0.0000% |   0.0000% |      $0 |        0.0000 |
| 1980-12-17 |     $10002 | 0.0069% | 0.0069% |  1.7321% |   1.7321% |      $2 |      100.0000 |
| 1980-12-23 |     $10023 | 0.0116% | 0.0116% |  8.7665% |   8.7665% |     $23 |      100.0000 |
| 1980-12-24 |     $10029 | 0.0117% | 0.0117% | 11.0696% |  11.0696% |     $29 |      100.0000 |
| 1980-12-26 |     $10041 | 0.0154% | 0.0154% | 11.5742% |  11.5742% |     $41 |      100.0000 |
| 1980-12-29 |     $10042 | 0.0150% | 0.0150% | 12.4075% |  12.4075% |     $42 |      100.0000 |
| 1980-12-30 |     $10039 | 0.0173% | 0.0173% |  9.9769% |   9.9769% |     $39 |      128.4113 |
portfolio-total
This function returns the current total value of the portfolio.
Parameters:
- none
Example:
(portfolio-total)

;; output:
10039.706976028898
portfolio-daily-ret
This function returns the current daily return of the portfolio.
Parameters:
- none
Example:
(portfolio-daily-ret)

;; output:
-1.381737451156456E-4
portfolio-total-ret
This function returns the total daily return of the portfolio.
Parameters:
- none
Example:
(portfolio-total-ret)

;; output:
0.0017210374553336212
Update Configuration
update-rolling-window
This function updates the time window for computing the rolling functions (i.e. r-vol and r-sharpe). By default, the time window is set as 30.
Parameters:
n- new time window for computing the rolling functions in the evaluation report
Example:
(update-rolling-window 3)

;; output:
Time window is updated as 3. ; success message
Plot Graphs
Functions for generating line plots on chosen variables.
plot
This function allows users to plot line charts. This plotting function works the best with the Jupyter Notebook.
Parameters:
- dataset - contains a map of data to be plotted. Each map should be in the following format:
{:permno "AAPL" :date "1980-12-15" :price "27.00" :return "-0.5 } series- series name of the lines to appear in the legendx- key that contains that x-axis data in the dataset, e.g.:datey- key that contains that y-axis data in the datset, e.g.:portfolio-valuefull-date- boolean, set to true if you want to have full date (i.e. month, day, year) as labels in the x-axis; if set as false the function would automatically choose the appropariate labels
Note: pass full-date as true when plotting variables in the evaluation report.
Example:
;; data to print: an atom of maps
(first data) ;; print first row
;; output
;; {:date "1980-12-16", :pnl-pt 7.806415917975755, :sharpe 1.4142135623730954, :tot-val 10007.806415917976, :vol 0.05517816194058409}
;; Add legend name to series
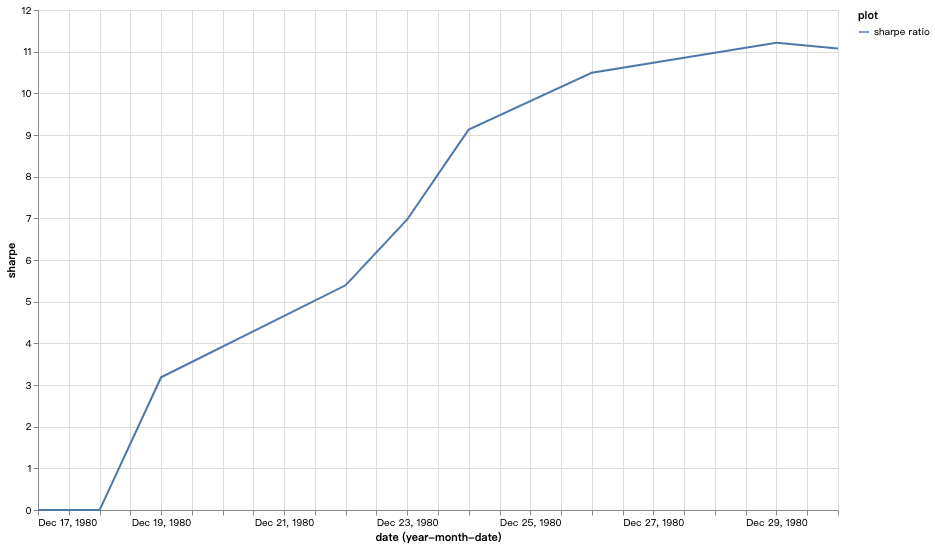
(def data-to-plot
(map #(assoc % :plot "sharpe")
data))
;; Call plotting function
(plot data-to-plot :plot :date :vol true)
Output: