Get Started
Setting Up the Playground
Before installing in either way, first make sure to fulfill the basic requirements.
Leiningen REPL Platform
Clone the repository and decompress.
Under the project directory, run the below command in the terminal to start a Leiningen REPL.
lein replRun the examples in the
/examplesfolder line by line in the REPL.
Gorilla REPL
Gorilla REPL is similar to Jupyter Notebook and is used for running strategies code.
- Run the following command in the terminal to start the REPL.
lein gorilla;
- When the process is completed, you should see the following output:
Gorilla-REPL: 0.6.0
Unable to reach update server.
Started nREPL server on port 50649
Running at http://127.0.0.1:50651/worksheet.html .
Ctrl+C to exit.
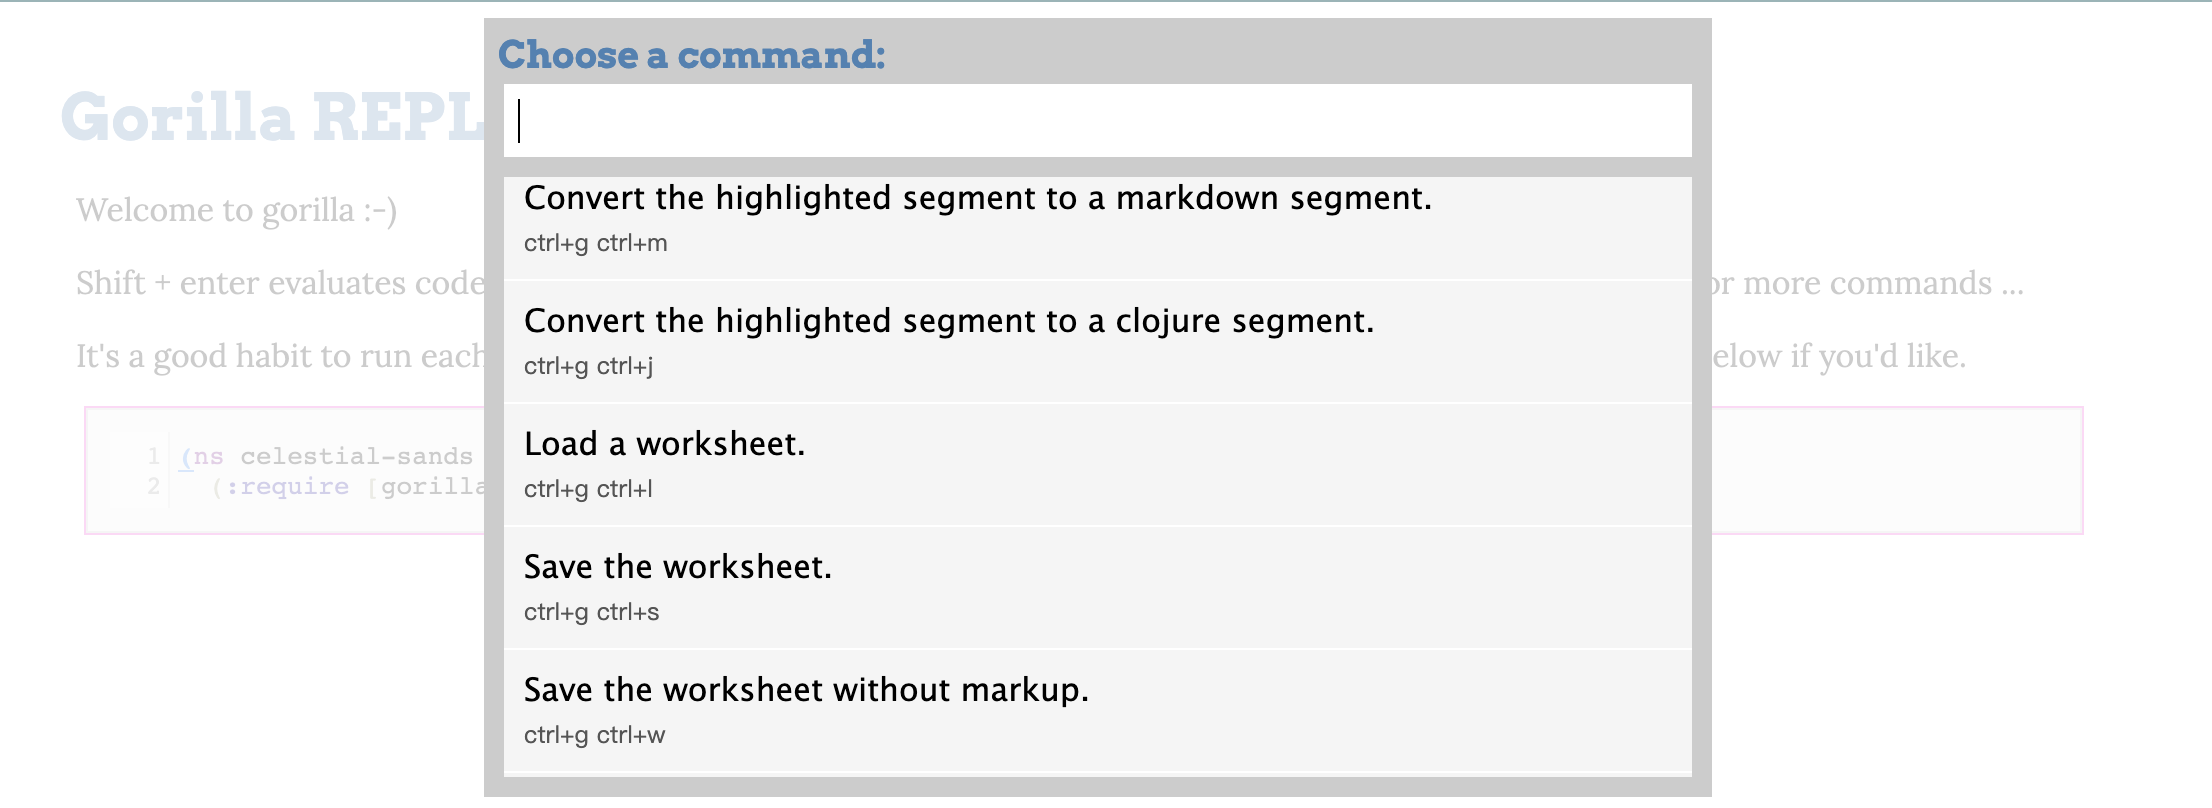
- Open the url in the output message with browser.
Click the option button on top right and choose "Load a worksheet"
Look for example worksheets in the example folder. Open the url in the output message with browser.
Then you can run each cell by pressing "Ctrl + Enter".
For further detail of Gorilla REPL, please read their website.
Clojure Beginner Tutorials
If you are new to clojure, we recommend having a quick read of the following tutorials first:
Clojure by Example - useful for beginners pick up the syntax quickly
Clojure Docs - a more thorough documentation that explains the built-in functions in Clojure
Clojure for the Brave and True - a book that helps you learn Clojure in an in-depth manner
Help & Support
In case you would encounter difficulties in using the API within the backtester or have any suggestions for additional examples, feel free to post it here.
Code Walkthrough
We'll go through the code in ./examples/Simple trading strategy.ipynb notebook to have a glimpse of how to write code that could be run with the backtester.
Import libraries
To make use of the functions in the backtester library, it is necessary to import them whenever you create a new jupyter notebook file. Also make sure that you've compiled the most up-to-date clojure-backteser kernel, and have selected it in the Jupyter Notebook application.
; import libraries from kernel
(ns clojure-backtesting.demo
  (:require [clojure-backtesting.data :refer :all]
            [clojure-backtesting.data-management :refer :all]
            [clojure-backtesting.portfolio :refer :all]
            [clojure-backtesting.order :refer :all]
            [clojure-backtesting.evaluate :refer :all]
            [clojure-backtesting.plot :refer :all]
            [clojure-backtesting.counter :refer :all]
            [clojure-backtesting.automation :refer :all]
            [clojure-backtesting.parameters :refer :all]
            [clojure-backtesting.indicators :refer :all]
            [clojure-backtesting.direct :refer :all]
            [clojure.string :as str]
            [clojure.java.io :as io]
            [clojure.pprint :as pprint]
  ) ;; require all libriaries from core
)
Import dataset
Load the CRSP dataset to the program by providing its path.
(load-dataset "/Volumes/T7/CRSP" "main" add-aprc)
Initialise portfolio
Pass the date ("YYYY-MM-DD") and initial capital (non-negative integer) to the init-portfolio function.
(init-portfolio "1980-12-16" 10000);
Check available securities
You could check what securities you could trade on the current date (i.e. 1980-12-16).
(available-permnos)
Write your strategy
With all these set-up, you are ready to write your strategy.
The below demo is a trading strategy that follows a simple logic.
Simple strategy
In a timespan of 10 days (inclusive of today),
- Buy 50 stocks of permno 14593 on the first day
- Sell 10 stocks of permno 14593 on every other day
;; define the "time span", i.e. to trade in the coming 10 days
(def num-of-days (atom 10))

(while (pos? @num-of-days) ;; check if num-of-days is > 0
    (do
        ;; write your trading strategy here
        (if (= 10 @num-of-days) ;; check if num-of-days == 10
            (do
                (order "14593" 50 :print true) ; buy 50 stocks
            )
        )
        (if (odd? @num-of-days) ;; check if num-of-days is odd
            (do
                (order "14593" -10 :print true) ; sell 10 stocks
            )
        )

        (update-eval-report) ;; update the evaluation metrics every day
        (println (get-date))
        ; move on to the next trading day
        (next-date)

        ; decrement counter
        (swap! num-of-days dec)
    )
)
Note that in the above snippets, it is necessary to iteratively call next-date so that the system could "move on to the next trading day". (check details here)
;; output:
1980-12-16
Order: 1980-12-17 | 14593 | 50.000000.
1980-12-17
Order: 1980-12-18 | 14593 | -10.000000.
1980-12-18
1980-12-19
Order: 1980-12-22 | 14593 | -10.000000.
1980-12-22
1980-12-23
Order: 1980-12-24 | 14593 | -10.000000.
1980-12-24
1980-12-26
Order: 1980-12-29 | 14593 | -10.000000.
1980-12-29
1980-12-30
Order: 1980-12-31 | 14593 | -10.000000.
By printing these debugging messages, I could double-check whether the orders were accurate.
Check order record
Alternatively, you could also directly view the order record.
(print-order-record)
;; output
|      :date |  :tic |  :price | :aprc | :quantity |
|------------+-------+---------+-------+-----------|
| 1980-12-17 | 14593 | 25.9375 | 25.35 |        50 |
| 1980-12-18 | 14593 | 26.6875 | 25.67 |       -10 |
| 1980-12-22 | 14593 | 29.6875 | 26.88 |       -10 |
| 1980-12-24 | 14593 | 32.5625 | 27.98 |       -10 |
| 1980-12-29 | 14593 | 36.0625 | 29.25 |       -10 |
| 1980-12-31 | 14593 | 34.1875 | 28.58 |       -10 |
View portfolio & portfolio record
You could view the portfolio and check the changes in portfolio value too. Note that the portfolio record could also be found in the out_portfolio_value_record.csv file.
(print-portfolio)
;; output:
| :asset | :price | :aprc | :quantity | :tot-val |
|--------+--------+-------+-----------+----------|
|   cash |    N/A |   N/A |       N/A | 10116.11 |
;; pass none so that the entire record is printed, else pass the no. of rows
(print-portfolio-record)
;; output:
|      :date | :tot-value | :daily-ret | :tot-ret | :loan | :leverage |
|------------+------------+------------+----------+-------+-----------|
| 1980-12-16 |  $10000.00 |      0.00% |    0.00% | $0.00 |      0.00 |
| 1980-12-17 |  $10000.00 |      0.00% |    0.00% | $0.00 |      0.00 |
| 1980-12-18 |  $10016.25 |      0.00% |    0.07% | $0.00 |      0.00 |
| 1980-12-19 |  $10043.73 |      0.12% |    0.19% | $0.00 |      0.00 |
| 1980-12-22 |  $10066.29 |      0.00% |    0.29% | $0.00 |      0.00 |
| 1980-12-23 |  $10081.29 |      0.06% |    0.35% | $0.00 |      0.00 |
| 1980-12-24 |  $10100.29 |      0.00% |    0.43% | $0.00 |      0.00 |
| 1980-12-26 |  $10122.77 |      0.10% |    0.53% | $0.00 |      0.00 |
| 1980-12-29 |  $10126.41 |      0.00% |    0.55% | $0.00 |      0.00 |
| 1980-12-30 |  $10123.21 |     -0.01% |    0.53% | $0.00 |      0.00 |
| 1980-12-31 |  $10119.51 |     -0.02% |    0.52% | $0.00 |      0.00 |
Generate evaluation report
If you update the evaluation report every day (as update-eval-report is called for 10 times in the loop), you'll obtain a evluation report with daily records.
Detailed explanation of the evaluation metrics could be found in the "Evaluate" section.
However, note that if you are traversing a large amount of dates, it would be better not to update the evaluation metrics every day as it would require a large amount of memory and computation time. Alternatively, you could print a small number of rows of the evaluation report.
Note that the evaluation report could also be found in the out_evaluation_report.csv file.
;; pass none so that the entire record is printed, else pass the no. of rows
(print-eval-report)
;; output
|      :date | :tot-value |    :vol |  :r-vol |  :sharpe | :r-sharpe | :pnl-pt | :max-drawdown |
|------------+------------+---------+---------+----------+-----------+---------+---------------|
| 1980-12-17 |     $10000 | 0.0000% | 0.0000% |  0.0000% |   0.0000% |      $0 |        0.0000 |
| 1980-12-18 |     $10015 | 0.0000% | 0.0000% |  0.0000% |   0.0000% |      $7 |        0.0000 |
| 1980-12-19 |     $10042 | 0.0578% | 0.0578% |  3.1854% |   3.1854% |     $21 |      100.0000 |
| 1980-12-22 |     $10064 | 0.0517% | 0.0517% |  5.3929% |   5.3929% |     $21 |      100.0000 |
| 1980-12-23 |     $10078 | 0.0490% | 0.0490% |  6.9722% |   6.9722% |     $26 |      100.0000 |
| 1980-12-24 |     $10097 | 0.0461% | 0.0461% |  9.1301% |   9.1301% |     $24 |      100.0000 |
| 1980-12-26 |     $10119 | 0.0491% | 0.0491% | 10.4957% |  10.4957% |     $29 |      100.0000 |
| 1980-12-29 |     $10122 | 0.0473% | 0.0473% | 11.2136% |  11.2136% |     $24 |      100.0000 |
| 1980-12-30 |     $10119 | 0.0467% | 0.0467% | 11.0778% |  11.0778% |     $23 |      111.5205 |
Plot variables
You could try plotting some variables shown in the portfolio record / evaluation report tables.
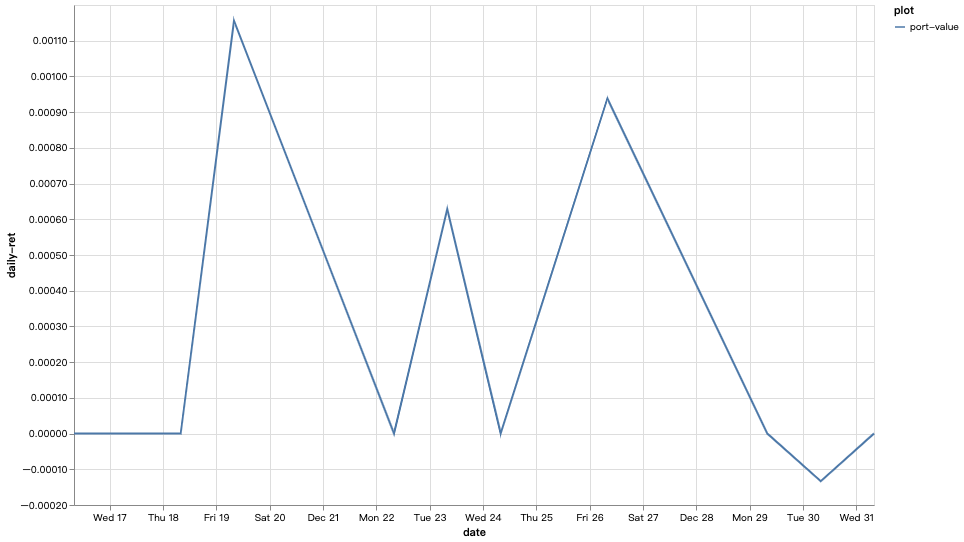
Plotting values in portfolio record
;; 1) Define the data to be the record that features the column
(def data (deref portfolio-value))

;; 2) Assign it to a new variable 'data-to-plot`, so that
;; we could have the legend name added (here = "port-value")
(def data-to-plot
 (map #(assoc % :plot "port-value")
  data))

;; 3) Pass the data and its keys to the plotting function
;; last arg "false" means we do not need full date to be shown on the x-axis
(plot data-to-plot :plot :date :daily-ret false)
Output:
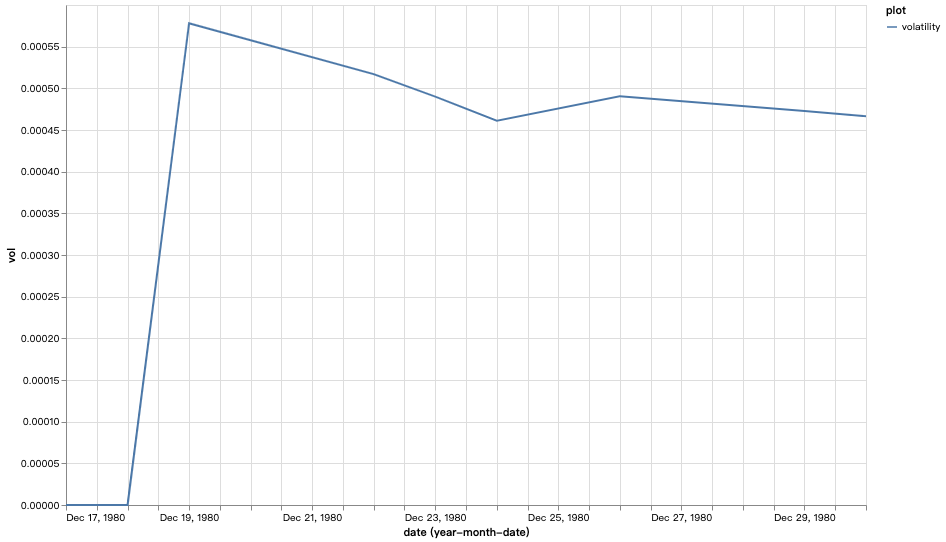
Plotting values in evaluation report
(def data (deref eval-record))
(def data-to-plot
 (map #(assoc % :plot "volatility")
  data))

;; Note that we need to set it as "true" for plotting values in eval-report
(plot data-to-plot :plot :date :vol true)
Output: