Open-source backtesting library · v1.1.3
Test trading ideas on history, one day at a time.
Clojure Backtesting replays daily market data from CRSP or Yahoo Finance, fills your orders the way a broker would, tracks cash, loans and short positions, shows your strategy only the company reports that were public at the time, and reports how it performed.
(load-dataset "resources/sample-data/main" "main" add-aprc)
(init-portfolio "1990-01-02" 10000)

;; Hold 50 shares of AAA while its price
;; is above its 10-day moving average
(while (< (compare (get-date) "1990-03-29") 0)
  (let [price (get-permno-price "10001")
        ma10  (moving-avg "10001" 10)]
    (when (and price ma10)
      (order "10001" (if (> price ma10) 50 0)
             :remaining true)))
  (update-eval-report)
  (next-date))
(end-order)
What you can do
A backtest replays history: your strategy sees the market one day at a time, places orders, and the library keeps the books. These are the parts it handles for you.
Day-by-day simulation
A global clock moves through trading days. Your code only sees data up to "today", so it cannot peek at the future.
Orders fill like a broker's
An order fills at the next trading day's close. Orders wait while a security has no price, and expire after a few days.
Margin and short selling
Borrow cash or shares under initial and maintenance margins, with optional commissions and loan interest.
Free data from Yahoo Finance
Download prices, dividends, splits, financial statements and earnings dates for any ticker, with no API key. Or use CRSP and Compustat.
Point-in-time fundamentals
Earnings, balance sheets, 15 ratios, growth rates and the Piotroski F-score, exactly as they were known on each day.
Rank and rebalance
Rank a universe by any measure, hold the top picks at target weights, and rebalance every week, month or quarter.
Dividends and splits
Dividends are reinvested or paid to cash, splits adjust the share count, and holdings of delisted securities become cash.
Technical indicators
Moving averages, EMA, MACD, RSI, rate of change, parabolic SAR, ATR and Keltner Channels.
Performance and benchmarks
Returns, volatility, Sharpe ratio and drawdown, plus beta, alpha and information ratio against an index, and charts in the browser.
Automated rules
Pair a condition with an action, such as a stop-loss, and the backtester checks it every trading day.
Data larger than memory
Data is read from disk one day at a time, with a cache. It has been tested with datasets of up to 30 GB.
How a backtest works
Every backtest follows the same four steps. The Key Concepts page explains each step in more detail.
Load the data
load-dataset points the library at daily prices; load-yahoo-dataset loads prices and fundamentals from Yahoo Finance.
Start a portfolio
init-portfolio sets the start date and the cash you begin with.
Step through the days
Each day, read prices or indicators, call order, then next-date to move on.
Review the results
end-order closes the positions. The records and the evaluation report show what happened.
What the example above produced
The strategy at the top of this page runs on the sample dataset that ships with the library. It holds 50 shares of the security AAA (10001) whenever the price closes above its 10-day average, and none otherwise.
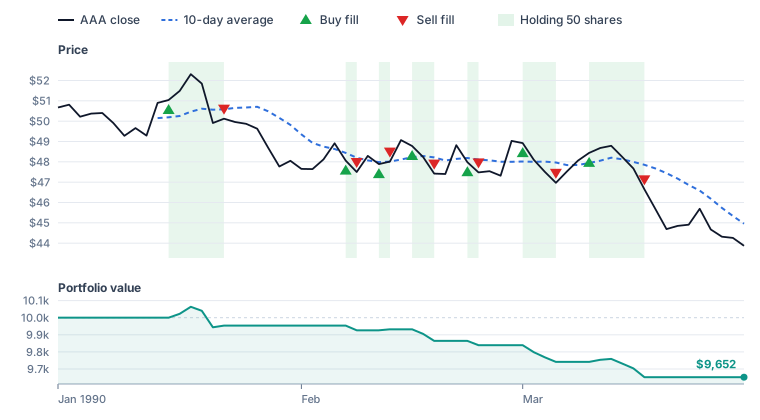
The rule lost $348 (3.5%). That is the point of backtesting: you find out on historical data, not with real money. The first fills in the order record:
|      :date | :permno | :price | :aprc | :quantity |
|------------+---------+--------+-------+-----------|
| 1990-01-16 |   10001 |  51.04 | 51.04 |      50.0 |
| 1990-01-23 |   10001 |  50.12 | 50.12 |     -50.0 |
| 1990-02-07 |   10001 |  48.06 | 48.06 |      50.0 |
| 1990-02-08 |   10001 |   47.5 | 47.50 |     -50.0 |
Strategies on fundamentals
Since version 1.1.2 the library also downloads data from Yahoo Finance, knows which company reports were public on each day, and has helpers for strategies that rank and rebalance. This value strategy holds, every month, the two companies with the highest earnings yield:
(build-yahoo-dataset! "resources/sample-yahoo" :out-dir "target/sample-yahoo")
(load-yahoo-dataset "target/sample-yahoo")
(update-transaction-cost 0.001)
(init-portfolio "2023-01-03" 100000)

(while (neg? (compare (get-date) "2024-12-31"))
  (when (new-period? :month)
    (rebalance (equal-weights (top-n earnings-yield 2 :universe ["ALFA" "BETA" "GAMA" "DLTA"]))))
  (next-date)
  (update-eval-report))
(end-order)
(benchmark-stats "IDX")
It runs on the synthetic Yahoo snapshots bundled with the library, two years of made-up companies, against their index:
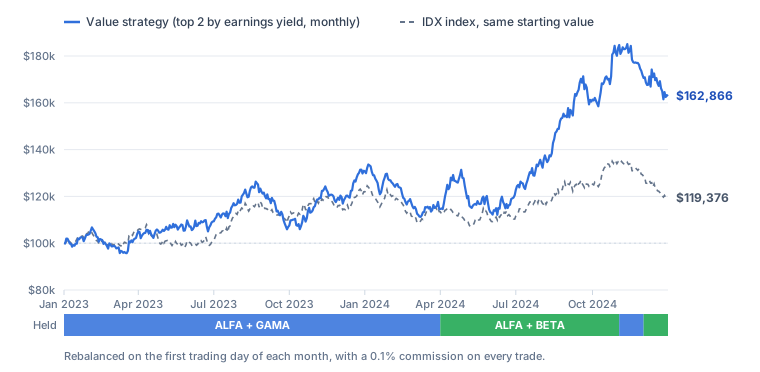
The Value Strategy example explains every step, and Yahoo Finance Data shows how to download real data.
Start learning
New to Clojure or to backtesting? Read these pages in order.
nil, and other common questions.Get unstuck →Video introduction
A walkthrough of the installation, an example strategy and tips for learning the library. It was recorded with an earlier version of the library, so some details differ from these pages.