Learn
Key Concepts
The ideas behind the library in plain words: the daily loop, when orders fill, which prices are used, how borrowing works, what was known when, and what the performance numbers mean.
On this page
- What a backtest is
- The shape of every backtest
- The clock: "today" and the date pointer
- When an order fills
- Securities and the sample dataset
- Prices: raw and adjusted
- Long, short and borrowed money
- Fundamentals as they were known
- Strategies that rank and rebalance
- Measuring performance
- Why backtests flatter
- Glossary
You do not need a finance background to use the backtester, but a few ideas come up on every page of this documentation. This page explains them once, with examples from the bundled sample dataset.
What a backtest is
A backtest runs a trading strategy on historical data as if it were happening live. On each day the strategy may only use information that was available on that day. It places orders, the backtester fills them at realistic prices, and at the end you see how much the strategy would have made or lost, and how risky the ride was.
A backtest is a cheap way to find out that an idea does not work. It cannot prove that one will: markets change, and a strategy tuned to fit the past often fails on new data. Treat good results as a reason to test further, on other periods and other securities.
The shape of every backtest
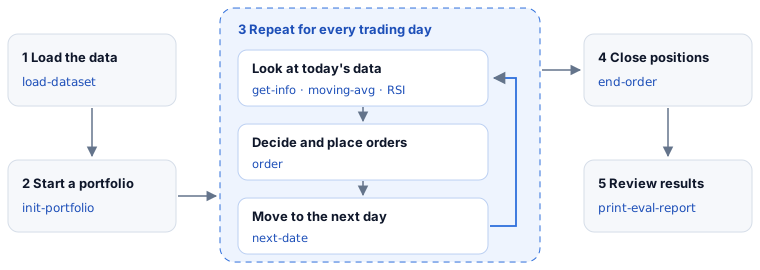
- Load the data.
load-datasetpoints the library at a directory of daily prices (the main dataset) and, optionally, company fundamentals (the Compustat dataset).load-yahoo-datasetloads prices and fundamentals downloaded from Yahoo Finance. - Start a portfolio.
init-portfoliosets the start date and your starting cash. Calling it again starts over. - Repeat for every trading day. Your code looks at today's data, decides, places orders with
order, and callsnext-dateto move to the next trading day. The library has no built-in loop: you write it, usually withwhileordotimes. - Close positions.
end-ordersells everything at today's close and ends the run. - Review results. Print the order record, portfolio and evaluation report, or plot them.
Here is the smallest useful version:
(load-dataset "resources/sample-data/main" "main" add-aprc)
(init-portfolio "1990-01-02" 10000)

(order "10001" 50)          ; buy 50 shares
(dotimes [_ 10]             ; let 10 trading days pass
  (next-date)
  (update-eval-report))
(end-order)                 ; sell everything

(print-portfolio-record -1)
The clock: "today" and the date pointer
The backtester has a single global clock, the date pointer. get-date tells you where it is. Every data function answers relative to it: get-info returns today's rows, get-prev-n-days returns earlier ones, and indicators such as moving-avg are computed from today backwards.
The clock only moves forward, one trading day per call to next-date, skipping weekends and holidays (any date not in the dataset). No function returns data from after "today", so your strategy cannot accidentally use tomorrow's prices. This mistake is called look-ahead bias, and it is the most common way backtests produce results that are too good to be true.
When an order fills
An order does not fill when you place it. You place orders after seeing today's closing price, and you can no longer trade at a price that is already in the past. So the order becomes pending, and fills at the close of the next trading day:
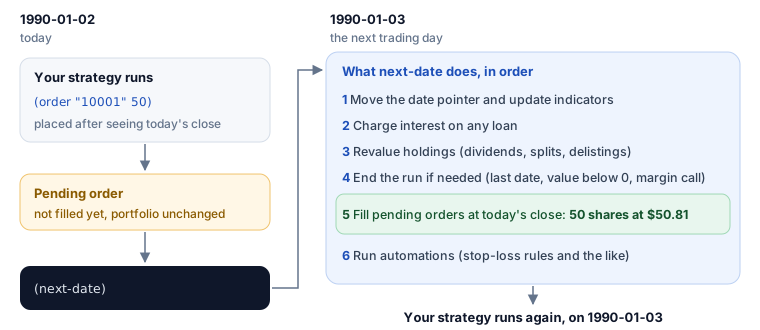
This is why the order record of the first backtest shows each order a day after it was placed. A few more rules:
- If the security has no price on the next day, the order waits, and expires after 3 trading days by default.
- An order is a number of shares. Positive buys, negative sells. With
:remaining truethe number is the holding you want to end up with, so(order "10001" 0 :remaining true)closes the position. - On the same day, sales fill before purchases, so the cash from a sale can pay for a purchase.
The Data and Trading Rules page lists every rule.
Securities and the sample dataset
Each security is identified by its PERMNO, a permanent number assigned by CRSP, the data provider the library was designed for. Permnos are strings in the API, such as "10001". The documentation uses permno and security for the same thing; permno-tic and tic-permno translate to and from ticker symbols. In a dataset built from Yahoo Finance, the permno is the ticker itself, such as "AAPL".
The sample dataset in resources/sample-data has three made-up securities over January to March 1990, each with a quirk that exercises part of the library:
| Permno | Ticker | Price range | Quirk |
|---|---|---|---|
10001 | AAA | about $44 to $52 | Pays a dividend on 1990-02-15 |
10002 | BBB | about $115 to $135, then $62 to $68 after the split | Splits 2-for-1 on 1990-03-01 |
10003 | CCC | about $18 to $21 | No prices from 1990-02-05 to 1990-02-09 |
Prices: raw and adjusted
Every row has two prices that matter:
:PRC, the raw closing price. Orders trade at this price, and the indicators are computed from it.:APRC, the adjusted price, added byadd-aprc. It follows the security's total return, so dividends and splits do not make it jump.
The difference shows on BBB's split. After 1990-03-01 one old share became two new ones, so the raw price halved while the adjusted price carried on. Two fills from the RSI example, before and after the split:
|      :date | :permno | :price |  :aprc | :quantity |
|------------+---------+--------+--------+-----------|
| 1990-02-22 |   10002 | 133.11 | 133.11 |      -5.0 |
| 1990-03-02 |   10002 |  66.92 | 133.84 |       5.0 |
The portfolio adjusts the share count on a split (5 shares become 10), and with reinvested dividends it also buys extra shares on dividend days, so neither event changes what your holding is worth. Indicators use the raw price, so a split looks like a crash to them. The Golden Cross example shows the effect.
Long, short and borrowed money
A long position is shares you own: you profit if the price rises. A short position is shares you borrowed and sold: you profit if the price falls, because you can buy them back cheaper. In the portfolio a short position has a negative quantity.
You can also buy more than your cash pays for. The shortfall is a loan, shown as negative cash. Borrowed cash and borrowed shares both magnify gains and losses, so the backtester limits them:
| Term | Meaning |
|---|---|
| Equity, total value | Cash plus long positions minus short positions: what you would have after closing everything |
| Gross position value | Long positions plus short positions, both counted as positive |
| Leverage | (loan + short positions) / equity |
| Margin | equity / gross position value. 100% means no borrowing; lower means more borrowed |
| Initial margin | The margin a new borrowing order must keep, 50% by default. Orders that would go below it fail |
| Maintenance margin | The floor for the margin while you have borrowed, 25% by default. Below it, every position is closed (a margin call) and the run ends |
Example. With $300 of cash, buying 10 AAA shares at $50.81 costs $508.10. The portfolio borrows $208.10, so leverage is 208.10 / 300 = 0.69 and margin is 300 / 508.10 = 59%. That is above the initial margin of 50%, so the order goes through. The Buying on Margin example follows this portfolio further.
Fundamentals as they were known
Prices are known at the end of each day. Company reports are not: a quarter's earnings are announced weeks after the quarter ends, and a backtest that used them on the last day of the quarter would trade on numbers nobody had yet. This is look-ahead bias again, and with fundamentals it is easy to commit by accident.
So every reported value carries three dates:
- the period end, the last day of the quarter or fiscal year it covers;
- the report date, when the company announced it;
- the public date, the first trading day a strategy may use it: the report date, or the next trading day for an announcement after the market closed.
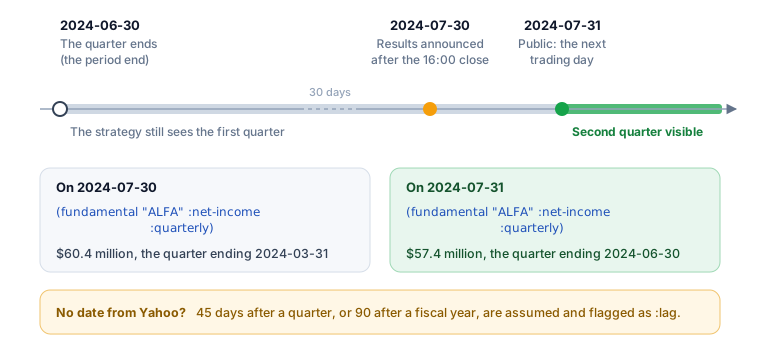
The fundamentals functions return, on each backtest day, the latest value whose public date has passed. They also restate the value for that day: per share of the day, so that earnings per share match the day's price even if the company split its shares later, and in the currency the shares trade in. A value whose period ended more than 18 months earlier counts as missing.
Report dates come from Yahoo where it has them. Where it does not, the library assumes the company reported 45 days after a quarter, or 90 after its fiscal year, and marks those values, so you can check whether a result depends on them. Compustat-style data is gated by its rdq (report date) column in a similar, simpler way: a filing counts from its report date, with no shift for announcements after the close and no estimated dates; see Data and Trading Rules.
Strategies that rank and rebalance
The simplest strategies watch one security and trade on its signals. Many professional strategies are cross-sectional instead: on a schedule, they rank a whole universe of securities by some measure (cheapness, quality, momentum), hold the best ones, and give each a weight, a fraction of the portfolio's value. Between two dates the prices move and the weights drift; rebalancing trades back to the targets.
The Strategy Helpers do each step: new-period? says when a month or quarter begins, top-n ranks, equal-weights makes the weights, and rebalance places the orders. Like any other order, they fill at the next close.
Measuring performance
update-eval-report adds today's metrics to the evaluation report. The metrics are:
| Metric | What it tells you |
|---|---|
| Daily return | How much the total value changed from yesterday, as a log return: ln(today / yesterday). Log returns add up over days |
| Total return | The sum of the daily log returns since the start |
| Volatility | How much the daily returns vary (their standard deviation). Higher means a bumpier ride |
| Sharpe ratio | Average daily return divided by volatility, scaled to a year (× √252). Return per unit of risk; above 1 is usually considered good |
| Maximum drawdown | The largest fall from a peak in total value, as a percentage of that peak. The worst loss you would have sat through |
| Profit per trade | (total value − starting cash) / number of filled orders, not counting the orders end-order places |
The rolling versions (r-vol, r-sharpe) use only the last 30 trading days, to show how risk changes over time. The Evaluation page has the exact definitions.
A return means more next to what the market did over the same days. benchmark-stats compares the run with an index or ETF in the dataset:
| Metric | What it tells you |
|---|---|
| Beta | How strongly the portfolio moved with the benchmark. 1 means one-for-one; 0.5 means half as much |
| Alpha | The yearly return beyond what the market exposure (beta) explains. Positive is good |
| Correlation | How closely the daily returns moved together, from −1 to 1 |
| Tracking error | How far the returns strayed from the benchmark's, a year. Low for index-like portfolios |
| Information ratio | The return above the benchmark per unit of tracking error, a year. Like a Sharpe ratio for beating an index |
Why backtests flatter
Backtests tend to look better than live trading. The usual reasons, and what the library does about them:
| Bias | What happens | What to do |
|---|---|---|
| Look-ahead bias | The strategy uses prices or reports before they were available | The date pointer and the fundamentals' public dates prevent it; don't use fundamental-as-of or get-permno-info with future dates |
| Survivorship bias | The universe only contains companies that survived until today, so the failures are missing | CRSP includes delisted securities. Yahoo does not: treat results on it as optimistic |
| Overfitting | Trying many variants and keeping the best one finds luck, not skill | Decide the rules first, test on a period you did not use to choose them, and count your attempts; see Sweep a parameter |
| Costs | Real trades pay commissions, spreads and market impact | Set update-transaction-cost, and remember it does not model spreads or impact |
Glossary
| Term | Meaning |
|---|---|
Adjusted price (:APRC) | A price series that includes dividends and splits, so it moves with the total return |
| Alpha | Return beyond what the market exposure explains, per year |
| Automation | A condition and an action that the backtester checks every trading day; see Automation |
| Benchmark | An index or ETF to compare a strategy with |
| Beta | How strongly a portfolio moves with its benchmark |
| Compustat | A database of company financial statements. The library joins it to the daily data by report date |
| Cross-sectional strategy | A strategy that ranks many securities against each other and holds the best |
| CRSP | The Center for Research in Security Prices, the source of the daily data the library is designed for |
| Date pointer | The backtester's clock, the current "today" |
| Delisting | A security that stops trading. After 10 trading days without a price, a holding is turned into cash at its last value |
| Dividend | Cash a company pays to shareholders. Reinvested in more shares by default |
| Earnings surprise | How far reported earnings per share beat or missed the analysts' estimate |
| Earnings yield | Twelve-month earnings per share over the price; the inverse of the P/E ratio |
| Expiration | How many trading days a pending order waits for a price, 3 by default |
| F-score | Piotroski's 0-to-9 score of improving financial health; see Fundamentals |
| Fill | The moment an order is executed, at the next trading day's close |
| Fundamentals | Values from a company's financial statements: revenue, earnings, assets, debt |
| Information ratio | Return above the benchmark per unit of tracking error |
| Look-ahead bias | Using information in a backtest that was not available at the time; the date pointer prevents it |
| Overfitting | Tuning a strategy until it fits the past, so that it fails on new data |
| Pending order | An order placed but not yet filled |
| Period end | The last day of the quarter or year a reported value covers |
| Permno | CRSP's permanent identifier for a security, such as "10001"; in a Yahoo dataset, the ticker |
| Point-in-time | Data as it was known on a date, not as it is known today |
| Public date | The first trading day a reported value may be used |
| Rebalance | Trading a portfolio back to its target weights |
| Report date | The day a company announced its results |
| Split | A company dividing each share into several. The raw price falls, the adjusted price does not |
| Survivorship bias | Testing only on securities that still exist, which leaves out the failures |
| Tracking error | How much a portfolio's returns differ from its benchmark's, per year |
| Trailing twelve months (TTM) | The sum of the last four quarters, or the last fiscal year |
| Weight | A holding's share of the portfolio's value |