Examples
Example: Value Strategy
Every month, hold the two companies with the highest earnings yield, using only the reports that were public at the time, and compare the result with an index.
This walkthrough follows the worksheet value_strategy.clj. It runs on the library's synthetic Yahoo snapshots, so it needs no network connection; open it in Gorilla REPL with make start (see Get Started), or paste the code into lein repl.
You will use: build-yahoo-dataset! and load-yahoo-dataset, earnings-yield, new-period?, top-n, equal-weights, rebalance and benchmark-stats.
The idea
Value investing buys companies that are cheap relative to what they earn. A common measure is the earnings yield: the last twelve months' earnings per share divided by the share price. It is the inverse of the P/E ratio. A company earning $5 a share at a price of $100 has an earnings yield of 5% and a P/E of 20.
The yield ranks better than the P/E: a company that loses money has a negative yield and ranks last, while its P/E would be meaningless.
The strategy:
- On the first trading day of every month, rank the universe by earnings yield.
- Hold the top two, half the portfolio each, and sell anything else.
- Pay a commission of 0.1% on every trade.
The point of a backtest like this is to get the timing of the information right. A company's earnings for a quarter are only known weeks after the quarter ends. The fundamentals functions return what was public on each day, so the strategy cannot trade on numbers that were not yet out.
Setup
Build the dataset from the snapshots in resources/sample-yahoo and load it. The universe is the four companies of the sample; IDX is an index, kept as the benchmark.
(build-yahoo-dataset! "resources/sample-yahoo" :out-dir "target/sample-yahoo")
(load-yahoo-dataset "target/sample-yahoo")
Warning: ZZZZ has no prices: No data found, symbol may be delisted
Warning: BETA: 7 report dates are estimated from the reporting lag
"Date range: 2022-01-03 ~ 2025-01-01; Fundamentals: 5 securities, 33 reports, 1 FX series"
Try it offline describes the companies and explains the warnings.
The strategy
(update-transaction-cost 0.001)
(init-portfolio "2023-01-03" 100000)

(def universe ["ALFA" "BETA" "GAMA" "DLTA"])
(def picks (atom []))

(while (neg? (compare (get-date) "2024-12-31"))
  (when (new-period? :month)
    (let [top (top-n earnings-yield 2 :universe universe)]
      (swap! picks conj {:date (get-date) :picks top})
      (rebalance (equal-weights top))))
  (next-date)
  (update-eval-report))
(end-order)
(update-transaction-cost 0.0) ; back to the default for other runs in this session
Line by line:
new-period? :monthis true on the first trading day of each month, and on the first day of the run, so the portfolio is invested at once.top-n earnings-yield 2ranks the universe byearnings-yieldand returns the best two. DLTA has no statements, so its yield isniland it is never picked.equal-weightsturns the two picks into{permno 0.5}, andrebalanceplaces the orders: it sells holdings that are no longer picked and tops up or trims the others to half of the equity each. The orders fill at the next close.picksrecords each month's choice, to look at afterwards.
What it picked
(->> (deref picks)
     (partition-by :picks)
     (map first)
     (clojure.pprint/print-table))
|      :date |          :picks |
|------------+-----------------|
| 2023-01-03 | ["ALFA" "GAMA"] |
| 2024-04-01 | ["ALFA" "BETA"] |
| 2024-11-01 | ["ALFA" "GAMA"] |
| 2024-12-02 | ["ALFA" "BETA"] |
ALFA always ranks first. The second place changes three times, and each change follows a report becoming public:
| Date | ALFA | BETA | GAMA | What changed |
|---|---|---|---|---|
| 2024-03-28 | 5.98% | −2.55% | 3.06% | BETA's latest twelve months are still its loss-making fiscal 2022 |
| 2024-04-01 | 6.16% | 5.24% | 3.12% | BETA's fiscal 2023, with a profit, counts as public from today |
| 2024-11-01 | 5.33% | 2.84% | 2.86% | GAMA's third quarter (public 2024-10-28) lifts it just above BETA |
| 2024-12-02 | 5.91% | 3.57% | 2.89% | BETA's third quarter (public 2024-11-14) puts it back ahead |
Each row is (rank-by earnings-yield :universe universe) on that day. Notice BETA's dates. Yahoo has no report dates for BETA's recent periods, so the build assumed 90 days after the fiscal year (2024-03-30, a Saturday, so the next trading day) and 45 days after a quarter. fundamental-info says so:
;; on 2024-04-01
(select-keys (fundamental-info "BETA" :diluted-eps) [:value :period-end :public-date :report-date-source])
;; => {:value 0.4338315663650824, :period-end "2023-12-31", :public-date "2024-04-01", :report-date-source :lag}
Had BETA really reported in February, the strategy would have switched two months earlier. When a result hinges on such dates, try a different :report-lag-days and see whether it holds up.
Results
The last row of the evaluation report:
(last (deref eval-report-data))
{:date "2024-12-31", :tot-value "$162866", :vol "1.3020%", :r-vol "1.4015%", :sharpe "1.1415", :r-sharpe "-3.2197", :pnl-pt "$1232", :max-drawdown "16.7536%"}
The portfolio grew from $100,000 to $162,866 in two years, after commissions. The daily volatility of 1.30% is about 20.7% a year (× √252), the Sharpe ratio is 1.14, and the worst fall from a peak was 16.8%. The rolling Sharpe ratio is negative because the last 30 trading days were a decline. See Evaluation for the definitions.
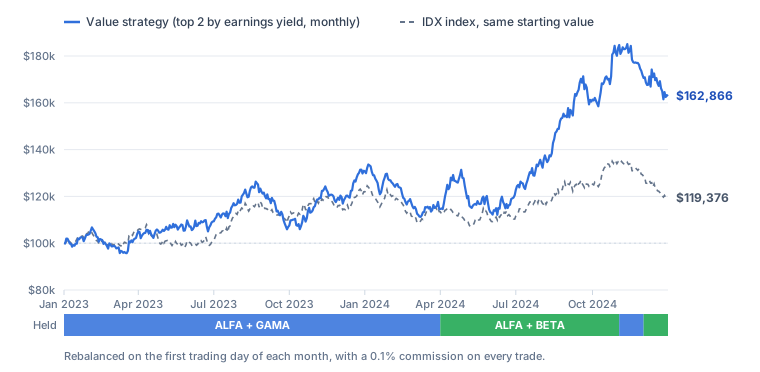
Against the index
Did the strategy do better than simply holding the market? benchmark-stats compares its daily returns with those of any security in the dataset, here the IDX index:
(into (sorted-map)
      (map (fn [[k v]] [k (if (double? v) (format "%.4f" v) v)]))
      (benchmark-stats "IDX"))
{:alpha "0.1483", :benchmark-return "0.1938", :beta "1.0258", :correlation "0.6613", :days 520, :excess-return "0.4349", :information-ratio "0.9698", :portfolio-return "0.6287", :tracking-error "0.1552"}
| Statistic | Value | Reading |
|---|---|---|
:portfolio-return | 62.9% | The strategy's total return over the 520 days |
:benchmark-return | 19.4% | The index's total return, dividends included |
:excess-return | 43.5% | The difference, in fractions of the starting value |
:beta | 1.03 | The strategy moved about one-for-one with the index: as risky as the market |
:alpha | 14.8% a year | Return beyond what the market exposure explains |
:correlation | 0.66 | Holding two stocks, the portfolio followed the index only loosely |
:tracking-error | 15.5% a year | How far its returns strayed from the index |
:information-ratio | 0.97 | Excess return per unit of tracking error, a year |
With a beta of about 1, the strategy took market risk and earned more than the market. Whether that is skill or luck is another question.
Takeaways
- Don't trust the numbers yet. The universe has three companies with fundamentals, the data is synthetic, and the strategy held ALFA the whole time. A real test needs a broad universe, several periods, and costs and slippage that match how you would trade.
- Report dates drive the trades. Every switch followed a report becoming public. Where dates are estimated, as for BETA, check that the result does not depend on the estimate.
- Survivorship bias. With real Yahoo data the universe only contains companies that still trade today, which flatters every strategy. See Limits of the data.
Try it:
- Rank by
book-to-marketorfree-cash-flow-yieldinstead, or hold three companies. - Rebalance with
(new-period? :quarter), and compare the commission paid. - Screen for quality first, for example
(filter #(some-> (piotroski-f-score %) (>= 5)) universe). - Real data:
(download-yahoo! "data/value" ["AAPL" "MSFT" "JNJ" "XOM" "JPM" "KO" "SPY"]), build and load it, and use"SPY"as the benchmark. Start the run about three and a half years before today, when the fundamentals begin.